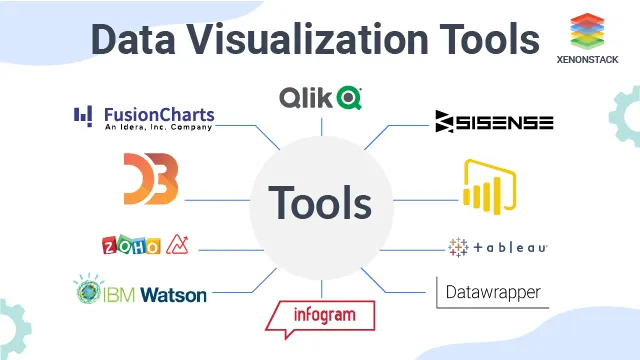
Data Visualization Tools for Mechanical Databases
Data visualization tools play a crucial role in extracting meaningful insights and patterns from complex mechanical databases. These tools help engineers, researchers, and analysts make informed decisions by presenting data in a visually intuitive format. One popular tool in this domain is Tableau, which allows users to create interactive and customizable dashboards. Tableau can connect to various mechanical databases, enabling users to visualize trends, performance metrics, and other key parameters.
Another powerful tool for visualizing mechanical data is Matplotlib, a Python library widely used in the scientific and engineering communities. Matplotlib provides a high level of customization, making it suitable for generating a wide range of plots and graphs to represent complex mechanical data. It integrates well with other Python libraries like NumPy and Pandas, facilitating seamless data manipulation and analysis.
For those looking for a comprehensive platform that combines data visualization with advanced analytics, Power BI is a popular choice. With its ability to connect to various mechanical databases, Power BI enables users to create interactive reports and dashboards. The tool also supports real-time data visualization, allowing engineers to monitor and analyze mechanical systems as they operate. Overall, these data visualization tools enhance the accessibility and interpretability of mechanical data, aiding professionals in making informed decisions and optimizing system performance.
Data Visualization Tools for Mechanical Databases
Data visualization is a crucial aspect of extracting meaningful insights from complex datasets, and this holds true for mechanical databases. The wealth of information stored in these databases, including design specifications, performance metrics, and maintenance records, can be better understood and communicated through effective visualization. Various data visualization tools are available to cater to the specific needs of mechanical engineers and professionals working with mechanical databases.
- Tableau: Tableau is a versatile data visualization tool that allows users to create interactive and shareable dashboards. For mechanical databases, Tableau can connect to various data sources, including relational databases, and generate visualizations such as charts, graphs, and heatmaps. Its drag-and-drop interface makes it user-friendly, enabling engineers to explore and present data effortlessly.
- Power BI: Microsoft Power BI is a powerful business analytics tool that integrates seamlessly with mechanical databases. It enables users to create visually compelling reports and dashboards. Power BI supports real-time data visualization, making it suitable for monitoring live data from mechanical systems. With features like custom visuals and natural language querying, Power BI caters to the diverse needs of mechanical engineers.
- Matplotlib and Seaborn (Python Libraries): For those who prefer working with Python, Matplotlib and Seaborn are excellent libraries for data visualization. Matplotlib provides a wide range of customizable plots, while Seaborn simplifies the process of creating informative statistical graphics. These libraries are particularly useful when working with large datasets from mechanical databases and conducting exploratory data analysis.
- D3.js: D3.js is a JavaScript library for creating dynamic, interactive data visualizations in web browsers. It is highly customizable and suitable for developing bespoke visualizations tailored to the specific requirements of mechanical databases. With D3.js, engineers can represent intricate relationships, such as assembly hierarchies or kinematic structures, in an engaging and informative manner.
- AutoCAD Data Visualization: AutoCAD, a widely used software in mechanical engineering, offers tools for visualizing 3D data directly within the design environment. Engineers can create 3D models, renderings, and animations based on data stored in mechanical databases. This integration between design and visualization enhances the understanding of how components and systems behave in different scenarios.
- Plotly: Plotly is a Python library that facilitates the creation of interactive visualizations, including 3D plots. Engineers working with mechanical databases can leverage Plotly to represent complex three-dimensional data, such as finite element analysis results or spatial relationships between components. Its ability to create interactive plots adds an extra layer of engagement to data exploration.
- Paraview: Paraview is an open-source data analysis and visualization application designed for large-scale, parallel processing. It is particularly powerful in visualizing computational fluid dynamics (CFD) simulations and other numerical analyses common in mechanical engineering. Paraview supports various data formats and enables engineers to gain insights into the behavior of mechanical systems.
- Fusion 360 (Autodesk): Fusion 360 is a comprehensive design and engineering software that includes visualization capabilities. Mechanical engineers can import data from databases directly into Fusion 360 to visualize assemblies, simulate motion, and conduct stress analyses. The software integrates seamlessly with cloud-based data management, facilitating collaborative visualization efforts.
In conclusion, the selection of data visualization tools for mechanical databases depends on the specific requirements of the engineering tasks at hand. Whether it’s creating interactive dashboards, representing 3D spatial relationships, or visualizing simulations, the diverse range of tools available empowers mechanical engineers to extract actionable insights from their databases and communicate findings effectively.
Visualization Software for Mechanical Data
Visualization software tailored for mechanical data serves as a crucial bridge between complex datasets and actionable insights. As mechanical systems generate vast amounts of data, ranging from design parameters to operational performance, effective visualization is essential for engineers to understand, analyze, and make informed decisions. Here are some visualization software options specifically designed for handling mechanical data.
- ANSYS SpaceClaim: ANSYS SpaceClaim is 3D modeling software that integrates powerful visualization capabilities. It allows mechanical engineers to interact with and modify 3D models intuitively. The software’s visualization tools facilitate the exploration of geometries, assemblies, and simulation results. Engineers can easily inspect and manipulate intricate mechanical components to gain deeper insights into their designs.
- Siemens NX (Visualization Module): Siemens NX, a comprehensive product design and manufacturing solution, includes a Visualization Module. This module enables engineers to visualize complex mechanical assemblies, conduct design reviews, and analyze components in a realistic 3D environment. The visualization capabilities enhance collaboration and decision-making throughout the product development lifecycle.
- SolidWorks Composer: SolidWorks Composer is visualization software specifically designed for technical documentation and communication. It allows mechanical engineers to create interactive 3D visualizations, animations, and exploded views directly from CAD models. This aids in conveying assembly processes, maintenance procedures, and design concepts effectively to non-engineering stakeholders.
- Creo View (PTC): Creo View is a product visualization and collaboration solution by PTC. It supports the visualization of 3D CAD models, facilitating collaborative design reviews. Mechanical engineers can use Creo View to explore assemblies, conduct virtual inspections, and share annotated 3D models with team members, suppliers, or customers.
- EnSight (CEI): EnSight, developed by Computational Engineering International (CEI), is visualization software focused on post-processing and visualizing simulation results. It supports a wide range of data formats and is particularly useful for visualizing fluid dynamics, structural analyses, and other simulations common in mechanical engineering.
- Tecplot: Tecplot is a visualization and analysis software specifically designed for engineers and scientists working with simulation and test data. It supports CFD, FEA, and other numerical simulations. Engineers in the mechanical field can use Tecplot to create visualizations of complex flow patterns, stress distributions, and thermal analyses.
- Creo Simulation Live (PTC): Creo Simulation Live is an extension of PTC’s Creo parametric CAD software that provides real-time simulation and visualization. Mechanical engineers can visualize and analyze the structural, thermal, and fluid flow behavior of their designs as they make changes. This instant feedback loop enhances the decision-making process during the design phase.
- COMSOL Multiphysics: COMSOL Multiphysics is a comprehensive simulation platform that includes powerful visualization capabilities. It allows mechanical engineers to visualize and analyze multiphysics phenomena, such as heat transfer coupled with structural mechanics. The software’s post-processing tools enable engineers to create insightful visualizations from simulation results.
- MSC Apex: MSC Apex is a simulation and modeling platform that incorporates direct modeling and advanced simulation capabilities. Its visualization tools enable engineers to interact with simulation results in a 3D environment. This immersive experience aids in understanding how mechanical components behave under different conditions.
These visualization software options provide mechanical engineers with the tools necessary to explore, understand, and communicate complex mechanical data effectively. Whether the goal is to optimize designs, troubleshoot performance issues, or convey concepts to stakeholders, these software solutions enhance the visualization and analysis of mechanical data throughout the product development lifecycle.
3D Data Visualization in Databases
3D data visualization in databases is a powerful technique that enables mechanical engineers and designers to comprehend complex spatial relationships, assess designs, and make informed decisions. With the increasing availability of 3D data in mechanical databases, leveraging visualization tools becomes essential. Here’s an exploration of the significance and applications of 3D data visualization in the context of databases.
- Design Exploration and Validation: 3D data visualization allows engineers to explore and validate designs stored in databases. By visualizing 3D models, components, and assemblies, engineers gain a comprehensive understanding of the spatial relationships and can identify potential design issues or improvements. This aids in the validation of designs before they progress to the manufacturing phase.
- Assembly Visualization: Mechanical systems often consist of intricate assemblies with numerous components. 3D visualization in databases enables engineers to assemble and disassemble virtual models, inspecting how each part fits together. This is crucial for identifying interferences, ensuring proper clearances, and optimizing assembly processes.
- Simulation and Analysis Results: When databases store simulation and analysis results, 3D visualization becomes indispensable. Engineers can visualize stress distributions, fluid flow patterns, and thermal analyses in a three-dimensional space. This immersive visualization enhances the interpretation of simulation data and facilitates more informed engineering decisions.
- Maintenance Planning: For mechanical systems with maintenance requirements, 3D visualization aids in planning and executing maintenance activities. Engineers can navigate through 3D representations of equipment, identifying access points, understanding part relationships, and visualizing potential challenges in the maintenance process.
- Prototyping and Rapid Iteration: 3D data visualization supports rapid prototyping and iteration. Engineers can quickly visualize design iterations stored in databases, assessing the impact of changes on the overall form and function. This iterative process accelerates the design cycle, leading to more optimized and efficient solutions.
- Collaborative Design Reviews: Collaborative design reviews benefit greatly from 3D data visualization. Teams can remotely access and visualize 3D models stored in databases, facilitating discussions on design changes, performance evaluations, and overall project progress. This collaborative approach enhances communication and decision-making among team members.
- Training and Documentation: 3D visualization is valuable for training purposes and creating documentation. Mechanical databases may store information related to equipment, machinery, or systems. Visualizing this data in a 3D format aids in creating interactive training materials and comprehensive documentation for maintenance procedures or assembly instructions.
- IoT and Sensor Data Visualization: In the era of the Internet of Things (IoT), mechanical systems often generate real-time sensor data. 3D data visualization in databases allows engineers to represent sensor data spatially. This can include visualizing sensor readings on 3D models of equipment, providing insights into operational conditions and potential issues.
- Augmented Reality (AR) Integration: The integration of 3D data visualization with augmented reality technologies is an emerging trend. Engineers can overlay virtual 3D models onto the physical environment using AR, providing an immersive and interactive experience. This is particularly useful for on-site inspections, maintenance tasks, and training scenarios.
- Kinematic and Dynamic Analysis: 3D visualization aids in kinematic and dynamic analyses of mechanical systems. Engineers can visualize the motion of components, simulate assembly processes, and assess the dynamic behavior of systems. This is crucial for understanding how mechanical systems will perform under various operational conditions.
In conclusion, 3D data visualization in databases is a transformative capability for mechanical engineers, offering a holistic view of designs, simulations, and operational data. As databases continue to evolve to accommodate increasingly complex and voluminous 3D data, leveraging advanced visualization tools becomes essential for enhancing decision-making, collaboration, and overall efficiency in the field of mechanical engineering.
Graphical Representation of Mechanical Data
Graphical representation plays a pivotal role in transforming complex mechanical data into meaningful insights that are easy to understand and analyze. In the realm of mechanical engineering, where data can be vast and intricate, graphical representation serves as a visual language that enhances comprehension and decision-making. Here’s an exploration of the significance and applications of graphical representation for mechanical data.
- Graphs and Charts: Utilizing traditional graphs and charts, such as line graphs, bar charts, and pie charts, is a fundamental approach to represent mechanical data. For instance, a line graph can illustrate the variation of temperature over time, while a bar chart can compare the performance metrics of different components. These visualizations provide a quick and intuitive overview of key parameters.
- Scatter Plots: Scatter plots are valuable for visualizing the relationships between two variables. In mechanical applications, engineers can use scatter plots to identify correlations between parameters, such as the relationship between force and displacement in a mechanical system. This graphical representation aids in recognizing patterns and trends within the data.
- Heatmaps: Heatmaps are effective for visualizing large datasets and identifying patterns of intensity or concentration. In mechanical engineering, heatmaps can represent temperature distributions, stress concentrations, or other spatial variations. Engineers can quickly identify regions of interest and potential areas for optimization or troubleshooting.
- Contour Plots: Contour plots are particularly useful in visualizing three-dimensional data on a two-dimensional plane. In mechanical applications, contour plots can depict stress distributions across a surface or temperature gradients within a component. This type of graphical representation enhances the understanding of spatial variations in mechanical data.
- 3D Plots: Three-dimensional plots provide a comprehensive view of complex mechanical data. Engineers can visualize the three-dimensional structure of components, assemblies, or simulation results. This graphical representation is instrumental in understanding spatial relationships, identifying interference, and optimizing designs.
- Animated Graphs: Animated graphs add a temporal dimension to graphical representation. For time-dependent mechanical data, such as dynamic simulations or transient responses, animation can effectively convey the evolution of parameters over time. Engineers can observe how mechanical systems behave dynamically and identify critical points in the process.
- Box Plots: Box plots, or box-and-whisker plots, are useful for visualizing the distribution and variability of data. In mechanical engineering, box plots can represent the variability in material properties, manufacturing tolerances, or experimental measurements. Engineers can quickly assess the spread of data and identify outliers.
- Pareto Charts: Pareto charts combine bar charts with line graphs to highlight the most significant factors contributing to a phenomenon. In mechanical data analysis, Pareto charts can be employed to identify the most critical sources of variation, defects, or performance issues. This graphical representation aids in prioritizing areas for improvement.
- Gantt Charts: Gantt charts are beneficial for visualizing project timelines and task dependencies. In mechanical engineering projects, Gantt charts can represent the scheduling of design phases, manufacturing processes, and testing activities. This graphical representation assists in project planning and management.
In conclusion, graphical representation of mechanical data is a powerful tool for engineers to gain insights, make informed decisions, and communicate complex information effectively. Whether it’s understanding spatial relationships, identifying patterns, or visualizing temporal variations, choosing the appropriate graphical representation enhances the analytical capabilities of mechanical professionals.
Dashboard Tools for Database Visualization
Dashboard tools designed for database visualization empower users to transform raw data into actionable insights through intuitive and interactive interfaces. In the context of mechanical databases, where information can be vast and multidimensional, leveraging dashboard tools streamlines the process of monitoring, analyzing, and interpreting data. Here’s an exploration of the significance and applications of dashboard tools for database visualization in mechanical applications.
- Tableau: Tableau is a leading dashboard tool that facilitates dynamic and interactive data visualization. For mechanical databases, Tableau allows engineers to connect directly to databases, create dashboards, and generate visualizations such as charts, graphs, and maps. Its drag-and-drop interface makes it user-friendly, enabling users to explore and communicate complex data effortlessly.
- Microsoft Power BI: Power BI is a versatile business analytics tool that seamlessly integrates with mechanical databases. It enables users to connect to various data sources, including databases, and create interactive dashboards. Power BI’s extensive range of visualization options, from simple charts to complex heatmaps, supports engineers in extracting meaningful insights from their mechanical data.
- QlikView/Qlik Sense: QlikView and Qlik Sense are powerful dashboard tools that use associative data modeling to create interactive visualizations. In mechanical applications, engineers can use Qlik tools to explore relationships within datasets, perform root cause analyses, and gain a holistic view of their mechanical systems. The associative data model allows for seamless data exploration.
- Google Data Studio: Google Data Studio is a free, cloud-based dashboard tool that integrates with various data sources, including databases. Mechanical engineers can leverage Google Data Studio to create customized dashboards with interactive charts, tables, and maps. The collaborative features of the tool enable teams to share and collaborate on visualizations.
- Sisense: Sisense is a business intelligence platform that offers robust dashboard capabilities. For mechanical databases, Sisense allows engineers to create visually appealing dashboards with real-time data connectivity. The platform’s ability to handle large datasets and its range of visualization options make it suitable for analyzing complex mechanical data.
- Dundas BI: Dundas BI is a dashboard and business intelligence platform that provides extensive customization options for visualizations. Engineers working with mechanical databases can use Dundas BI to create dashboards tailored to their specific needs. The platform’s flexibility allows for the integration of diverse data sources and the creation of insightful visualizations.
- Looker: Looker is a modern data platform that emphasizes collaboration and exploration. In the context of mechanical databases, Looker enables engineers to create and share interactive dashboards. Its data modeling capabilities allow for the creation of a semantic layer, simplifying the process of extracting valuable insights from complex datasets.
- Zoho Analytics: Zoho Analytics is a cloud-based analytics and reporting tool that supports dashboard creation. Mechanical engineers can use Zoho Analytics to connect to their databases, create visually appealing dashboards, and share insights with team members. The platform’s collaboration features enhance communication and decision-making.
- Kibana: Kibana is an open-source data visualization platform that works seamlessly with Elasticsearch. In the realm of mechanical databases, engineers can use Kibana to create dashboards that visualize data stored in Elasticsearch indices. The platform’s integration with Elasticsearch enables real-time data exploration and visualization.
- Domo: Domo is a cloud-based business intelligence and dashboard tool that facilitates data integration and visualization. Mechanical engineers can use Domo to connect to their databases, create dashboards, and gain insights into various aspects of their mechanical systems. Domo’s collaborative features support teamwork and knowledge sharing.
In conclusion, dashboard tools for database visualization in mechanical applications provide engineers with the means to transform raw data into actionable insights. Whether it’s monitoring real-time data, analyzing trends, or sharing findings with stakeholders, these tools offer intuitive interfaces and interactive features that enhance the overall data visualization experience.
Interactive Data Visualization for Mechanical Applications
Interactive data visualization is a powerful approach that allows mechanical engineers to explore, analyze, and interpret complex datasets in a dynamic and engaging manner. In the context of mechanical applications, where data can be multidimensional and intricate, interactive visualization tools enhance the understanding of system behavior, aid in decision-making, and facilitate collaboration. Here’s an exploration of the significance and applications of interactive data visualization for mechanical applications.
- Real-time Monitoring: Interactive data visualization enables real-time monitoring of mechanical systems. Engineers can observe live data streams, such as sensor readings, temperature variations, or performance metrics, in a dynamic and responsive interface. This real-time feedback is crucial for identifying anomalies, detecting issues, and ensuring optimal system operation.
- Parameter Exploration: Mechanical systems often involve numerous parameters that influence performance. Interactive visualizations allow engineers to dynamically explore the impact of different parameters on system behavior. By adjusting sliders, toggles, or input fields, engineers can observe how changes in parameters affect outcomes, facilitating optimization and design exploration.
- Simulation Interactivity: For simulations and virtual prototypes stored in databases, interactive visualization adds a layer of exploration. Engineers can manipulate 3D models, adjust simulation parameters, and observe the dynamic response in real-time. This interactivity aids in understanding the intricacies of simulations and enables engineers to validate designs more effectively.
- Multidimensional Data Analysis: Mechanical datasets are often multidimensional, with various variables influencing system performance. Interactive visualization tools allow engineers to delve into these multidimensional datasets, creating scatter plots, parallel coordinate plots, or 3D visualizations. This interactivity helps identify correlations, patterns, and outliers within complex datasets.
- Failure Mode Analysis: Understanding failure modes and potential issues in mechanical systems is crucial for reliability. Interactive data visualization allows engineers to explore failure scenarios, simulate the impact of component failures, and analyze the cascading effects on system performance. This proactive approach aids in designing robust and resilient systems.
- Collaborative Decision-making: Interactive visualizations facilitate collaborative decision-making by providing a shared platform for team members to explore and discuss data. Whether in design reviews, performance evaluations, or troubleshooting sessions, the ability to interact with visualizations in real-time enhances communication and ensures that decisions are informed by collective insights.
- Customized Dashboards: Engineers can create customized dashboards with interactive elements that align with specific requirements. These dashboards may include sliders, filters, or interactive plots that allow users to focus on specific aspects of the data. Customization ensures that the visualization tools are tailored to address the unique challenges of each mechanical application.
- Historical Data Exploration: Interactive visualization tools support the exploration of historical data trends. Engineers can navigate through time-series data, zoom into specific periods, and observe how mechanical systems have evolved over time. This historical perspective is valuable for predictive maintenance, trend analysis, and performance benchmarking.
- Operational Scenario Analysis: Interactive visualizations enable engineers to simulate and analyze different operational scenarios. By adjusting parameters or introducing variations, engineers can assess the system’s response under various conditions. This capability is essential for optimizing operational strategies, evaluating system resilience, and preparing for unforeseen events.
- User-friendly Interfaces: Interactive visualization tools often feature user-friendly interfaces that require minimal coding or technical expertise. This accessibility empowers a broader audience, including non-specialists and decision-makers, to interact with and gain insights from mechanical data. User-friendly interfaces contribute to a more democratized approach to data exploration and analysis.

Digital twin technology has emerged as a transformative concept in the realm of mechanical systems, offering unprecedented opportunities for design, Read more
Historical data analysis for mechanical systems is a crucial aspect of understanding, optimizing, and maintaining the performance of various mechanical Read more

In the ever-evolving landscape of technology, the integration of artificial intelligence (AI) has become a cornerstone for optimizing various processes Read more

In the rapidly evolving landscape of technological innovation, the integration of cloud-based solutions has revolutionized the way industries manage and Read more
In conclusion, interactive data visualization is a transformative approach for enhancing the analysis and understanding of mechanical data. Whether exploring real-time data, simulating scenarios, or collaboratively making decisions, the interactive nature of these visualization tools empowers engineers to extract actionable insights and derive value from complex datasets in mechanical applications.